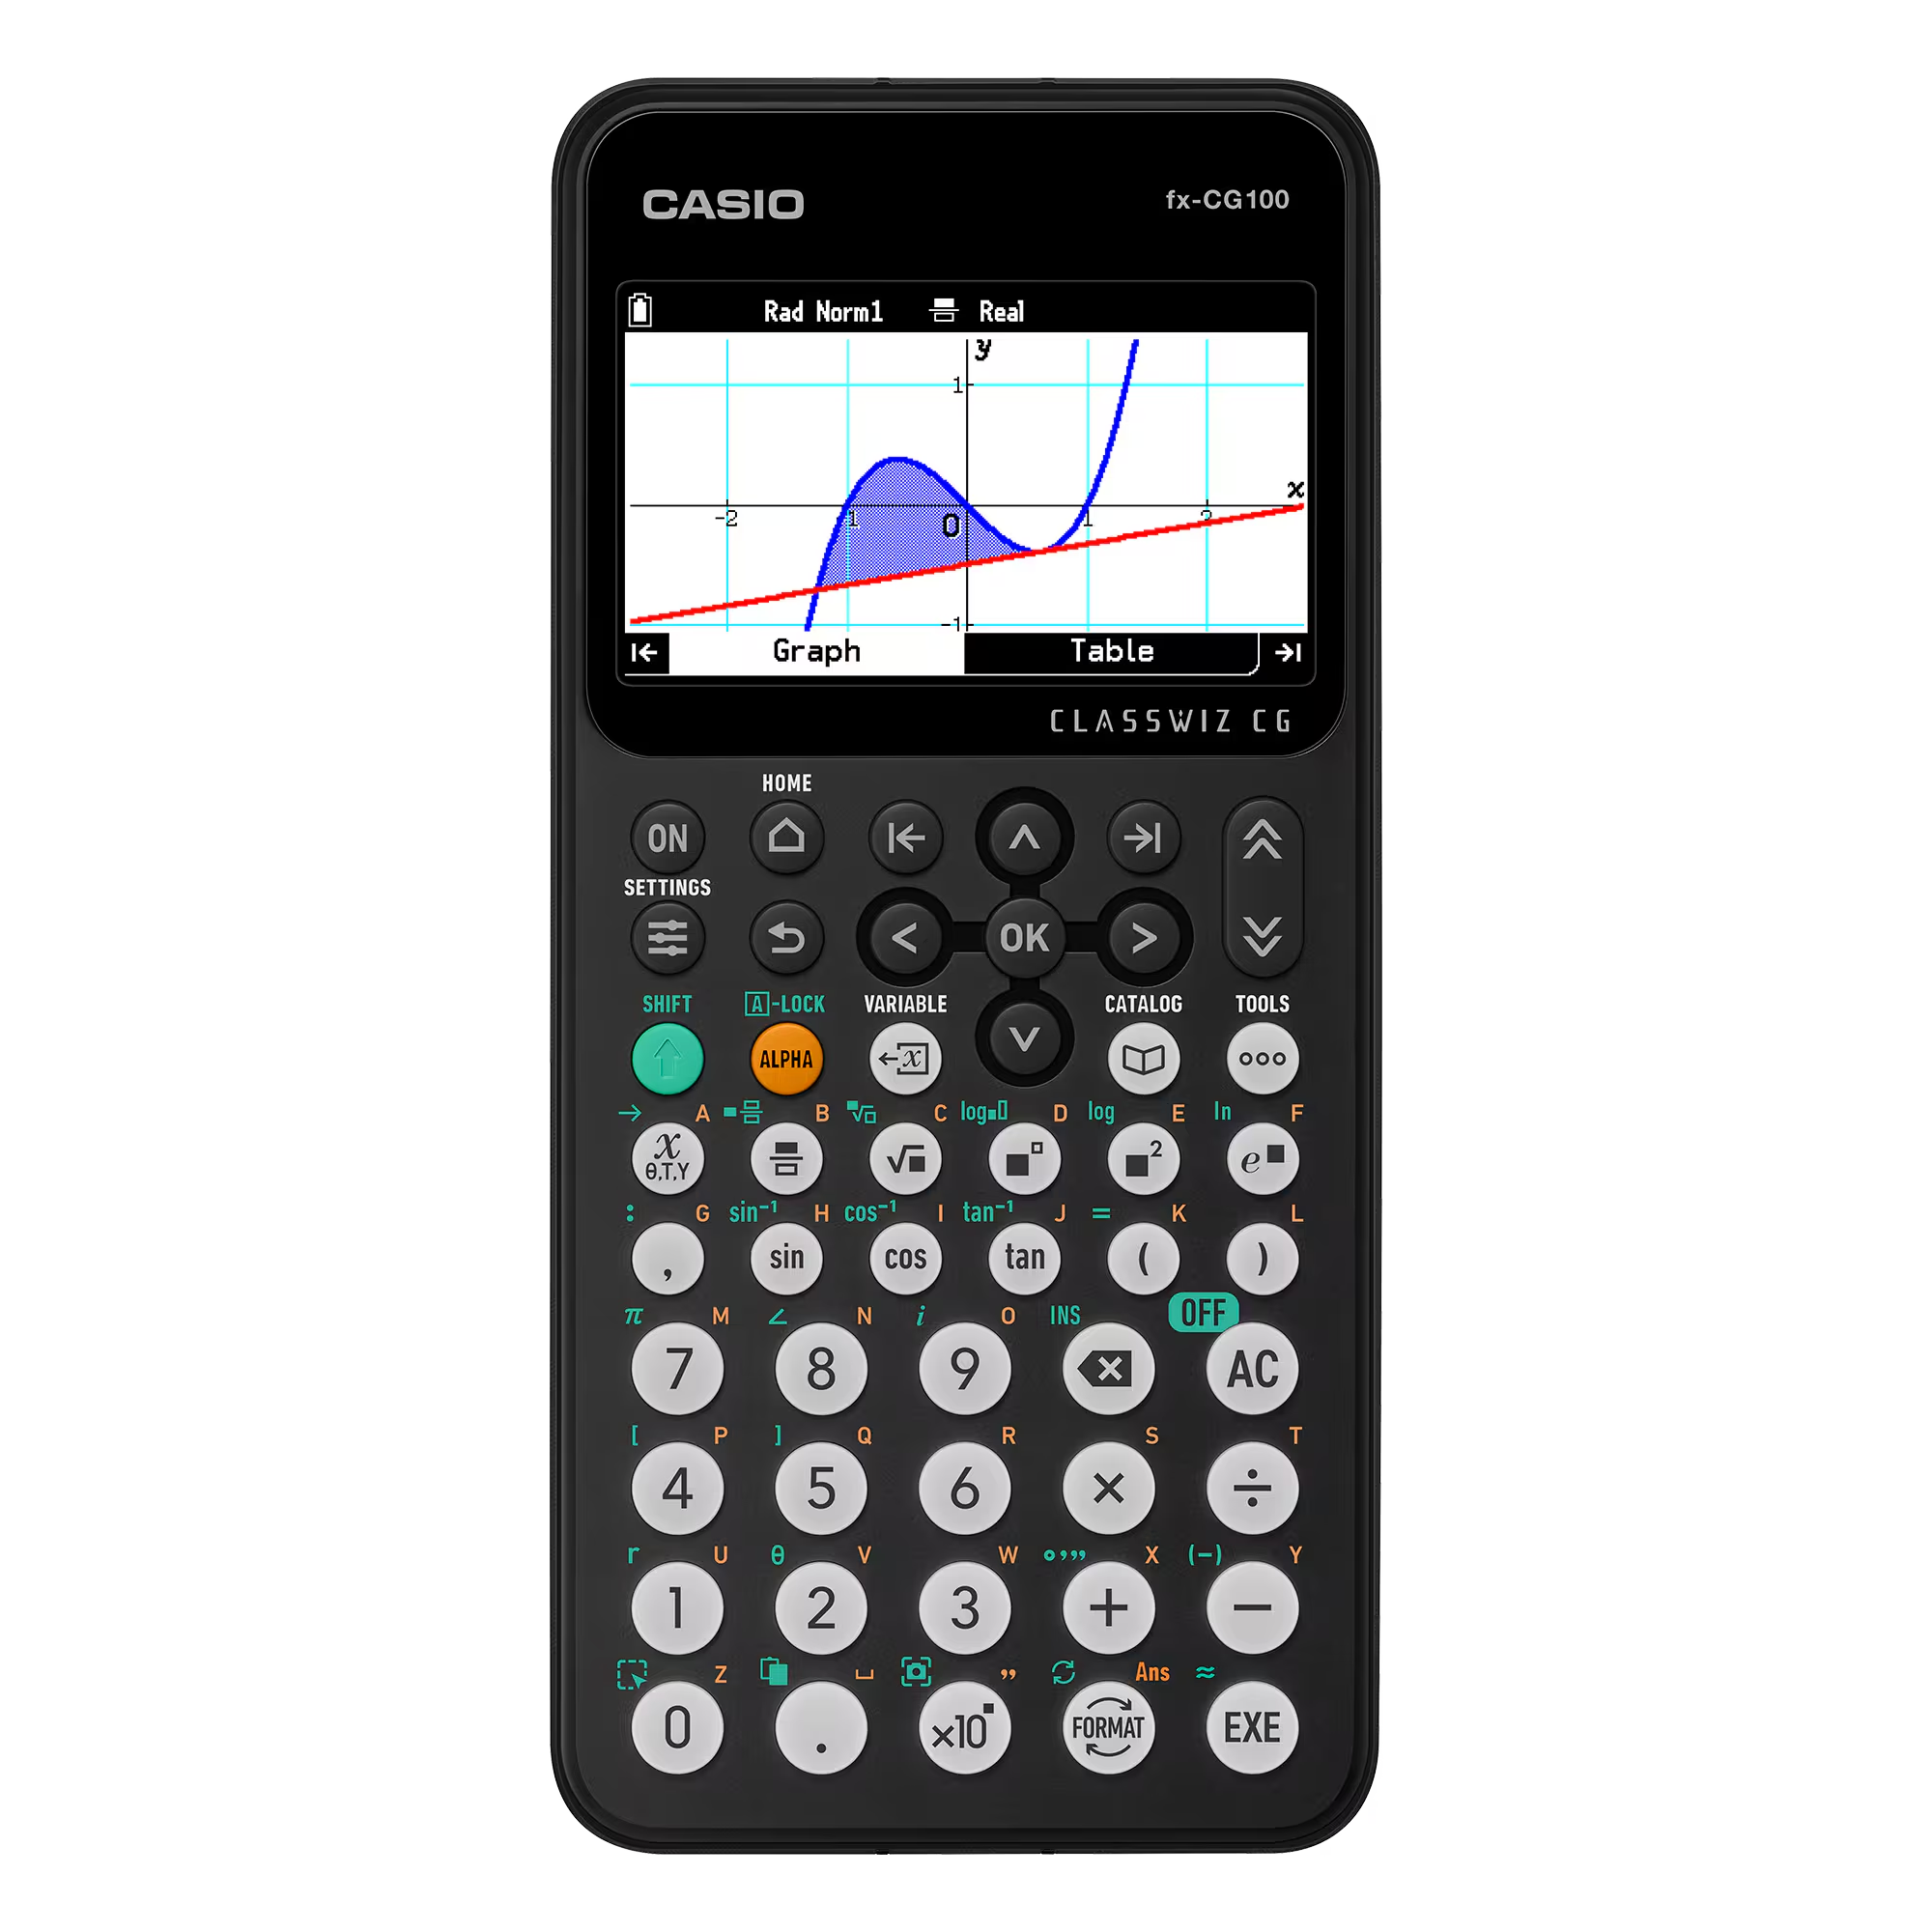
CASIO FX-CG100
JD160.00
FX-CG100
ClassWiz / 3D graph / Color display
Graphing Calculators
| color: | BLACK |
| brand: | CASIO |
| delivery: | FREE DELIVERY |
| Movement-type: | DIGITAL |
| guarantee: | ONE YEAR |
| power: | BATTERY |
| Type: | SCHOOL - LAB |
Additional details
- Spot clean as needed
- Hand wash with mild soap
- Free shipping on orders over $300
- International shipping available
- Easy return requests
- 60 day return window
Product Description
Basic Functions
• Angle unit, Angle unit conversion (Deg, Rad, Gra)
• Trigonometric functions, Inverse trigonometric functions
• Hyperbolic functions, Inverse hyperbolic functions
• Exponent functions, Logarithmic functions
• Power functions (square root, cubic root, square, power, radical root)
• Coordinate conversion (Pol, Rec)
• Combination/Permutation (nCr, nPr)
• Factorial, Inverse, Random numbers, Random sampling of an existing list, Fractions
• Logical operations
• Sexagesimal ↔ Decimal conversion
• Matrix calculations
• Vector calculations
• Complex number calculations
• Base-n calculations/conversions
• List data calculations
• Rounding
• Display format
• Conversion (pre-installed software)
• Engineering symbol calculation
• Engineering notation
• Prime Factorization
Graphing
• 3D Graph (pre-installed software)
• Rectangular coordinate graphing,Polar coordinate graphing
• Integration graph
• Parametric function graphing, Inequality graphing
• Trace, Zoom (box zoom, zoom in, zoom out, auto zoom)
• Table and Graph
• Sketch (tangent line, normal line, inverse function)
• Solve (root, minimum, maximum, intersection, integration: integral calculation improvement (real-time integral calculation), new integral calculation function (mixed integrals))
• Dynamic graph
• Recursion graph
Statistics
• List-based one-variable and two-variable statistical analysis
• Statistical regression calculations
• Statistical plot (scatter plot, xyLine, normal probability plot, histogram, box plot)
• Statistical regression graphs (linear, med-med, quadratic, cubic, quartic, logarithmic, exponential, power, sinusoidal, logistic regression)
• Advanced statistical calculations: tests (Z-test, t-test, χ²-test, F-test, ANOVA), intervals (Z-interval, t-interval), distributions
• Pie chart
• Bar graph
Hardware
• Power supply : Four AAA-size alkaline batteries or four nickel-metal hydride batteries
• Approximate battery life (hours) : 140 (AAA-size alkaline batteries), 85 (nickel-metal hydride batteries) Assuming 5 minutes calculation and 55 minutes display per hour
• Dot matrix display : 216 x 384 dots
• Display capacity (characters) : 21 x 8
• Internal operation digits : 15
• Nested parentheses levels : 26
• Data communication : 3-pin cable, USB cable
• 3-pin serial port
• USB port